This article explains how to use the best practise edison365ideas report template, and covers credentials, publication and scheduled report refreshing
We know the power of ideas. We also know the power of data coming from innovation portfolios, and that enterprise innovators need quick, easy insight into performance to make data driven decisions. That's why we've created a best practise template for you to use, so you can effortlessly develop and maintain a thorough understanding of the health of your innovation capability, with minimal input.
If you want to do even more with your reports, go beyond the basic setup, and maximise the value you can get from your ideas, please get in touch with our Sales team to find out more about how our analytics experts can help you
This article is aimed at those individuals who will be owning and maintaining this report functionality. If you are going to edit and share this report - read on!
This article includes basic setup information only. Information on the data model, relationships, calculated or custom columns and measures will not be provided.
Caution: Microsoft Power BI desktop is only available for Windows OS, and therefore is not available for Mac OS users.
Contents
Requirements
- Microsoft Power BI for desktop is required to access and edit this report. You can download Power BI desktop from Microsoft here.
- A target workspace within the Microsoft Power BI service is required in order to publish this report.
- A Microsoft Power BI Pro license is required to publish this report. Power BI Pro is included as part of the Microsoft 365 E5 license. Alternatively, this can be purchased individually for each account required. You can find more details on this from Microsoft here.
- This report queries data that is captured through the edison365ideas platform. This is stored in two ways: SharePoint, and Azure SQL. The individual publishing this report must have permission to access the data in SharePoint and the Azure SQL database.
- Azure SQL is only used to store gamification data. If you have not deployed an Azure SQL database and, as a result, are not using the gamification functionality, then all references to the Azure SQL data will be irrelevant for you.
Preparation
Access
As the person who will be responsible for sharing and perhaps maintaining this report, the very first thing you will need to do is confirm you have the necessary access permissions in place. The data in this report comes from up to two sources, depending on whether or not you are leveraging the gamification functionality.
SharePoint
To confirm you have access to the data stored within SharePoint, you will need to confirm you can access the SharePoint site collection where the edison365 app has been deployed. Your admin or IT team can confirm if you have this access.
Azure SQL database
To access the data stored within the Azure SQL database, the process is a little different. Your internal team responsible for managing IT infrastructure (like this Azure SQL database) can help you here. You'll need a a username and password to access the database. You will also need to add your IP address to the Azure SQL whitelist (and you can do this by sending your IP address to your IT team)
If edison365 are hosting your data, you'll need to speak to us for access to the data.
Software
Once you've confirmed access, the next thing you'll need to do is make sure you have access to the right software.
Power BI Desktop
(Read more here)
You'll need to download and install the Power BI desktop app. This is an essential requirement. You may need your IT team here if you need administrator privileges to install software.
You'll also need to make sure you have the right license to use Power BI. You'll need a Power BI Pro license in order to publish reports to share and collaborate. More information on licenses can be found here.
Power BI service / Power BI Online
(Read more here)
Once you've set the report up (more on that soon) you'll need a place to upload the report. This is done by publishing the desktop report to the Power BI service, where the report will be hosted online and become accessible to your wider business.
When you publish your report, you'll be asked to select which workspace you want to publish your report to.
Before we begin, make sure you know which workspace you're publishing to - and if you don't have one already, set on up. Again, you may need input and support from your IT team here.
Data
Next, you'll need to make sure there are some live entries in your edison365ideas instance. If you do not complete this step, you will encounter error messages when going through the first few steps of the process, and will be unable to properly load and begin customisation of your report.
- Challenge - there must be at least one challenge within your edison365ideas instance.
- Idea - there must be at least one idea within your edison365ideas instance
- Triage - there must be at least one idea review completed using the triage functionality. If this is not configured, it should be configured first and then completed.
Process
Once all of the above has been completed, you're ready to create your new edison365ideas report, using our curated template.
- Download Power BI file
The edison365 team will share a .pbit file with you. Download and store this in your file storage system of choice. - Open Power BI file
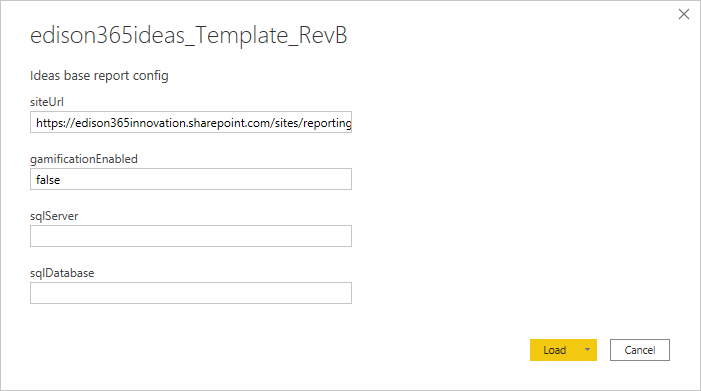
Next, you'll need to open the file we sent to you. You'll be presented with a dialog box, and asked to provide four pieces of information
- Fill in each of the fields
- If gamification is not enabled, you need to only provide your site collection URL (where the app has been deployed) and enter "false" in the gamificationEnabled field.
- If gamification is enabled, you'll need to confirm your site collection URL (where the app has been deployed), enter "true" in the gamificationEnabled field, and enter the details for the Azure SQL server and database where the gamification data is being hosted.
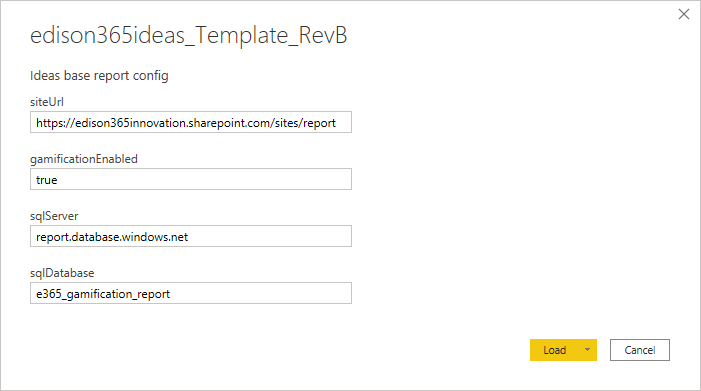
Don't know the server and database information? You can find this in the Manage Database tile, located in the admin panel of the edison365ideas app.
Once you've filled in all of the fields in the dialog box, select Load.
- If gamification is not enabled, you need to only provide your site collection URL (where the app has been deployed) and enter "false" in the gamificationEnabled field.
- Confirm credentials
The next step is to confirm your access credentials, in order to access both datasets.
-
- SharePoint site collection
To connect to the data stored in the SharePoint site collection, you will need to confirm the credentials which have been granted access to this data. Typically, this is done by selecting the Organizational account section on the left of the dialog box. Then, select Sign In - you will then be taken through the Microsoft 365 authentication process, as defined by your internal security settings and infrastructure.
Once you have successfully signed in, select Save in the bottom right hand corner of the dialog box. - If gamification is enabled, you'll also need to provide credentials to connect to the Azure SQL database.
As above, to connect to the data stored in the Azure SQL database, you'll need to confirm the credentials which have access to this data.
First, you'll be prompted to confirm that you want to run this query. Select Run in the bottom right hand corner of the dialog box.
Next, you'll need to confirm access credentials. Typically, this is done by selecting the Database section on the left of the dialog box. Then, enter the user name and password given to you by the IT team administering this.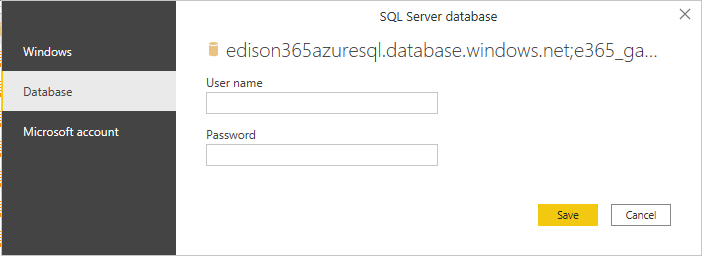
Once you have entered this information, select Save in the bottom right hand corner of the dialog box. IF you are prompted again to run the Azure SQL query, as above, Select Run in the bottom right hand corner of the dialog box.
You'll know this has worked if the data from your edison365ideas instances is now showing in the report. Try navigating through a few of the worksheets to check this. If successful, make sure you Save your report (CTRL + S) before you proceed to avoid losing any changes.
- SharePoint site collection
-
- Change header name
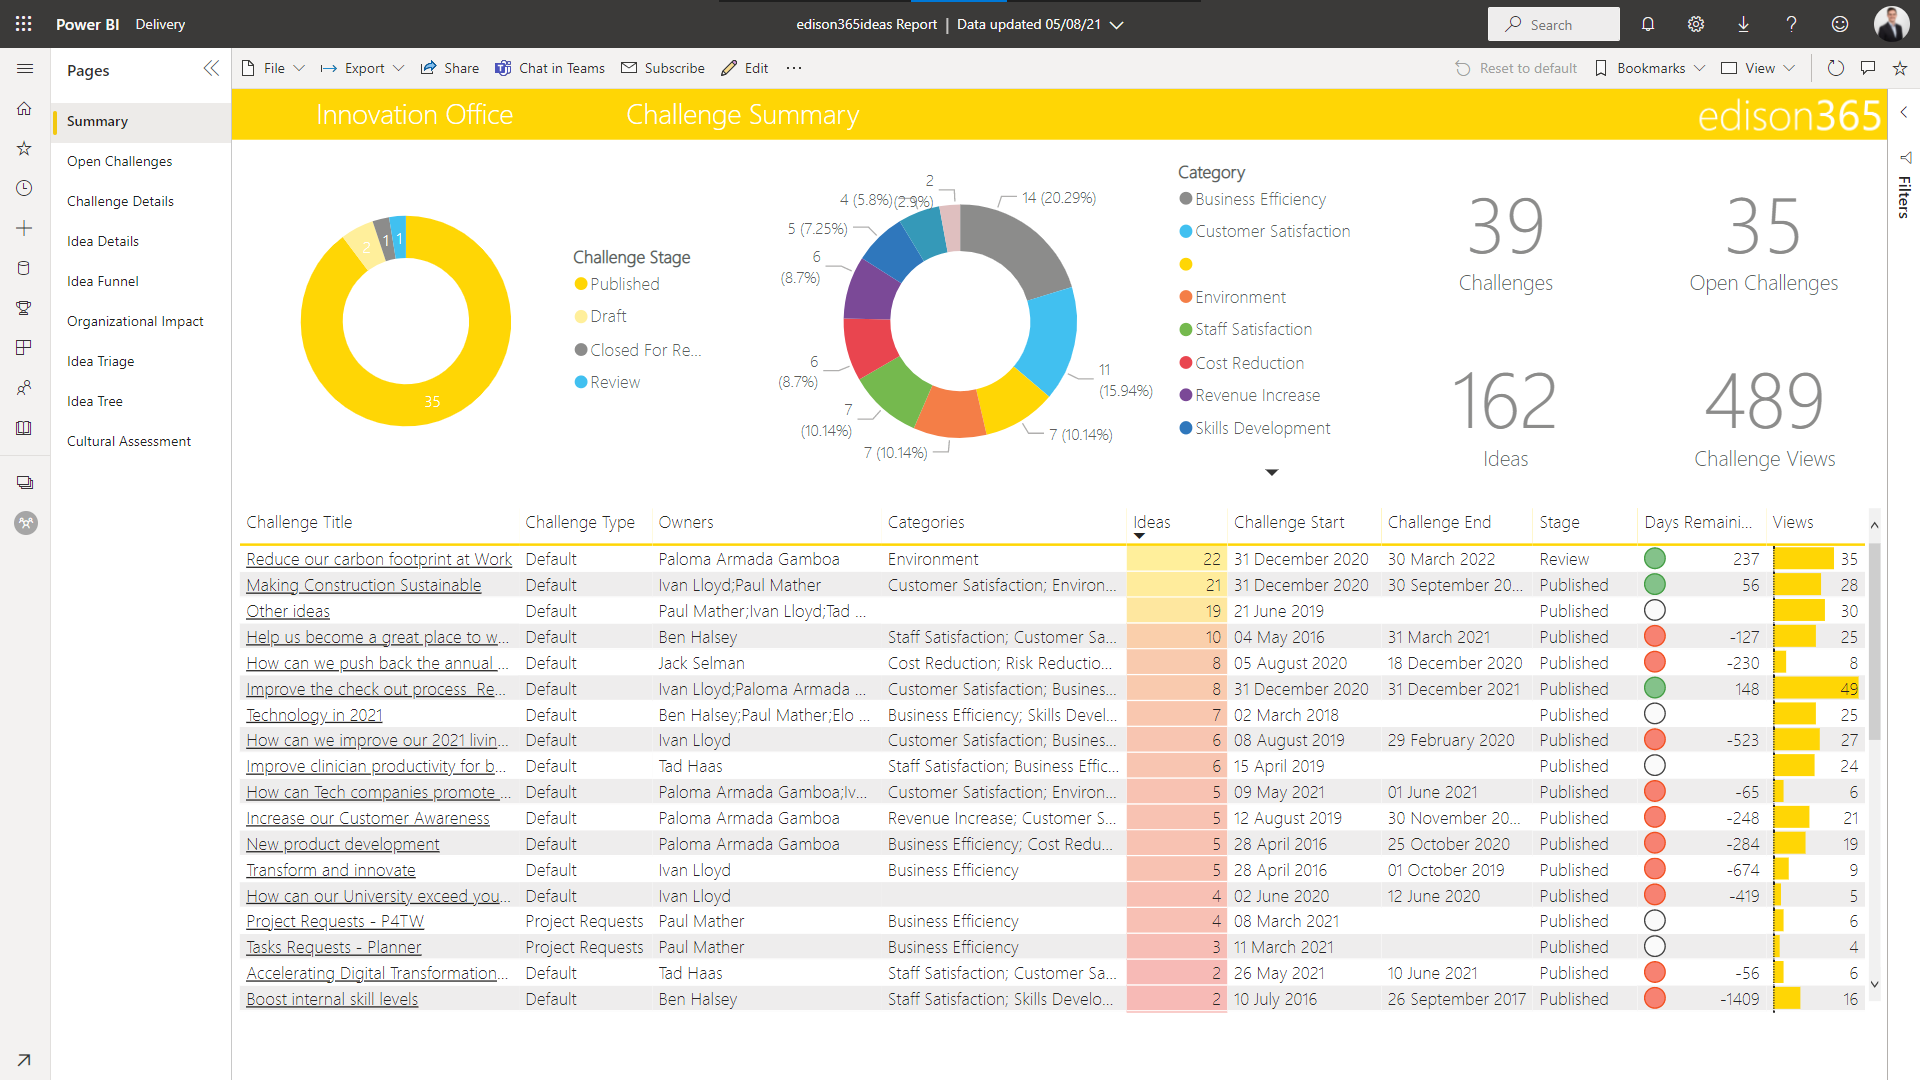
Now that you've successfully loaded in your template report, it's time to make a few tweaks to make it yours. The first change we are going to make is to the Client Name - this is the value we see in the top left hand side of each worksheet. This is often the company name, but could be your team, department, function - the choice is yours!
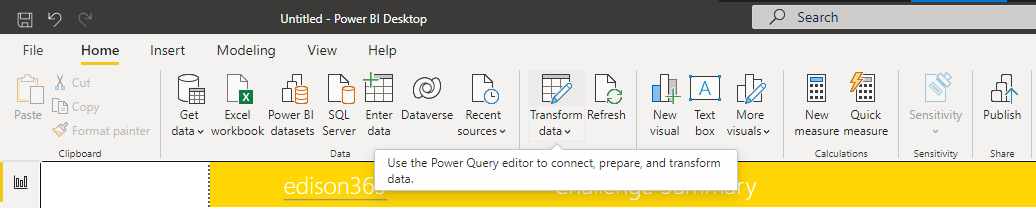
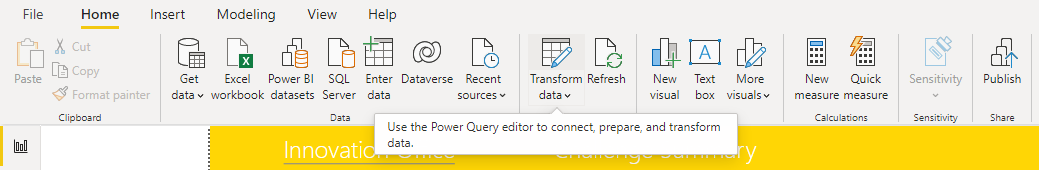
- First, select the Home tab across the top toolbar, then select the Transform data button. A new window will appear, listing all of the queries in the report. This is called Power Query Editor (more information on it here).
- Next, navigate to the Reference group in the left hand Queries panel. Within that group, select the Client Name query.

- Now, navigate to the Query Settings panel on the right hand side of the window. Then, within the Applied Steps panel, double click on the Source step. You can also click the gear icon, or right click and select Edit settings
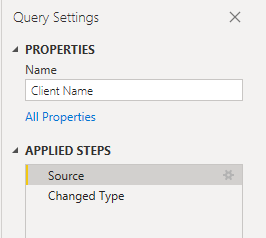
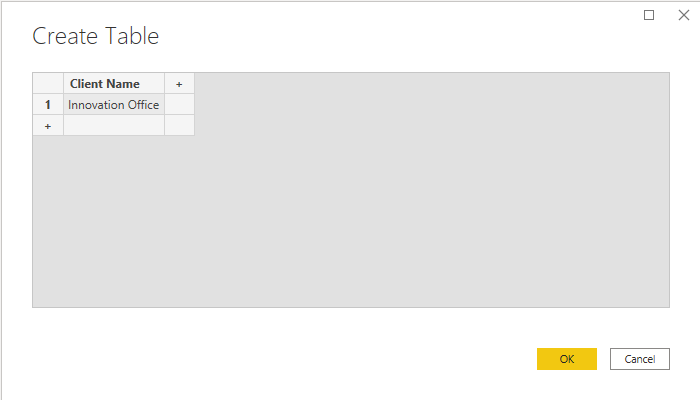
- Finally, in the dialog box that pops up - enter your desired value into the table. Once you're done, hit Ok in the bottom right hand corner.
If you're happy with your change, go ahead and select Close & Apply from the top left of the Power Query Editor window.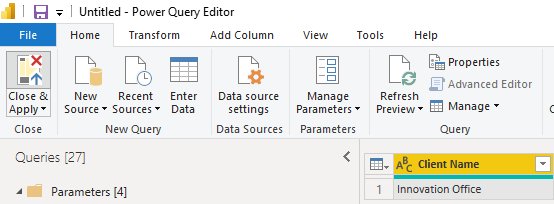
Once you've applied this change, you will see the value in the header bar has changed.
- First, select the Home tab across the top toolbar, then select the Transform data button. A new window will appear, listing all of the queries in the report. This is called Power Query Editor (more information on it here).
- Removing redundant content
Next, you'll remove redundant information. There may be elements of the edison365 suite that you're not leveraging yet, so we can delete or hide these worksheets. To delete or hide a worksheet, right click on it in the bar across the bottom, and select either Delete Page or Hide Page.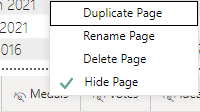
By default, these additional worksheets are hidden, and will not be surfaced to your users once the report is published.
- If gamification is not enabled, the Votes and Medals worksheets are redundant.
- If you are not using edison365ideas Open Innovation, the Ideas from OI worksheet is redundant.
- If you are not using edison365businesscase, the Ideas to Business Case worksheet is redundant.
- If you are not using edison365projects, the Ideas to Projects worksheet is redundant.
- Transforming your data
The template report is a standard file that will not reference any custom fields that you have created in your edison365ideas instance. To be able to use report on this information, you'll need to edit the queries. Here, we're going to look at a simple transformation to query data captured within your Ideas Forms only.- Select Transform data
- Select the Ideas query in the Ideas group of the Queries panel.

Once selected, you'll see your ideas data in the middle panel.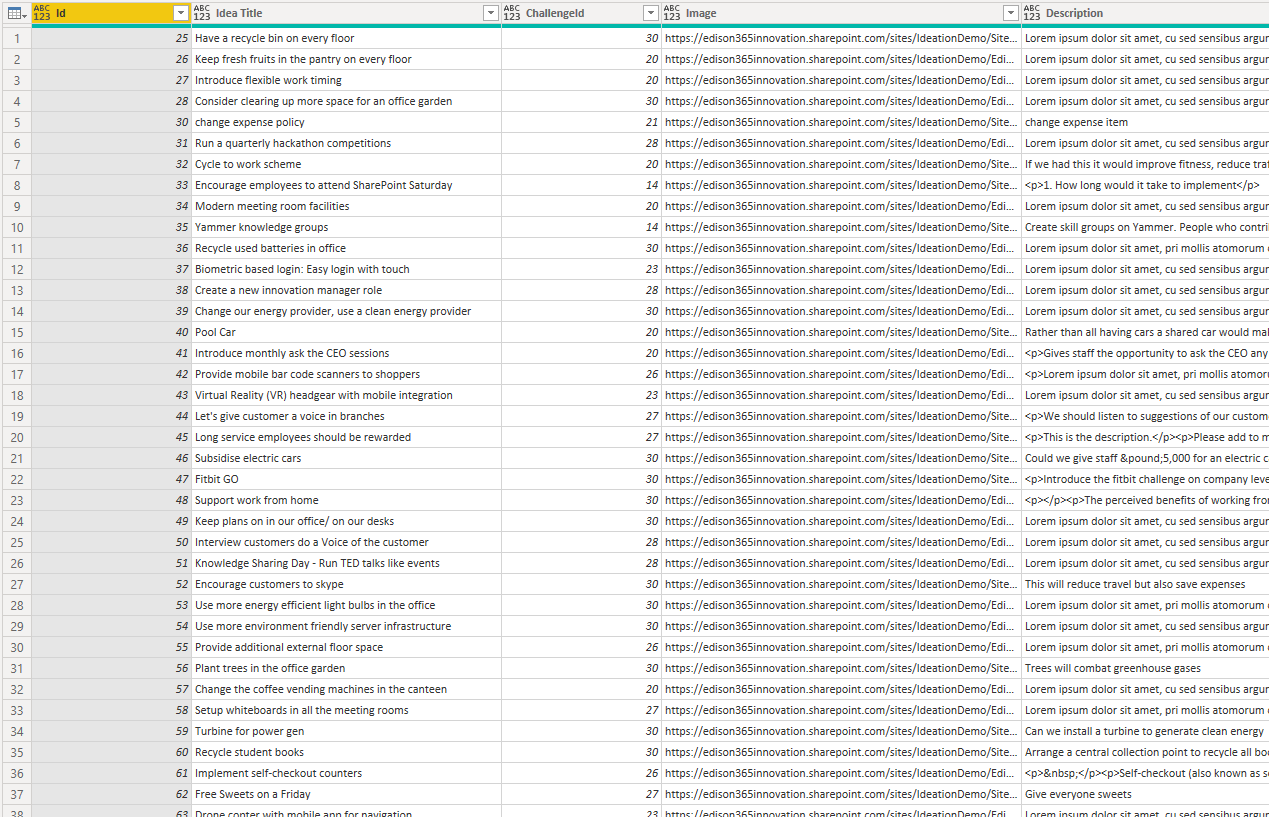
- Navigate to the Applied Steps panel on the right, and edit the Removed Other Columns step.

- In this Choose Columns dialog box, select the fields you do want to keep.

How do you find out which ones to keep? Refer to the Admin settings within your edison365ideas app. Navigate to the Configure Fields tile. Within the Ideas tab, you will see a table of all fields you have configured. The Name column shows the in-app name of this field. In the SharePoint Field column, you can see the name of this field within the SharePoint site collection. Use these two columns to make your selections in the Choose Columns dialog box.
Let's look at the screenshot below as an example. If I want to be able to report on the Approach field, I can see that this is the IdeaMultipleLinesofText01 field in SharePoint.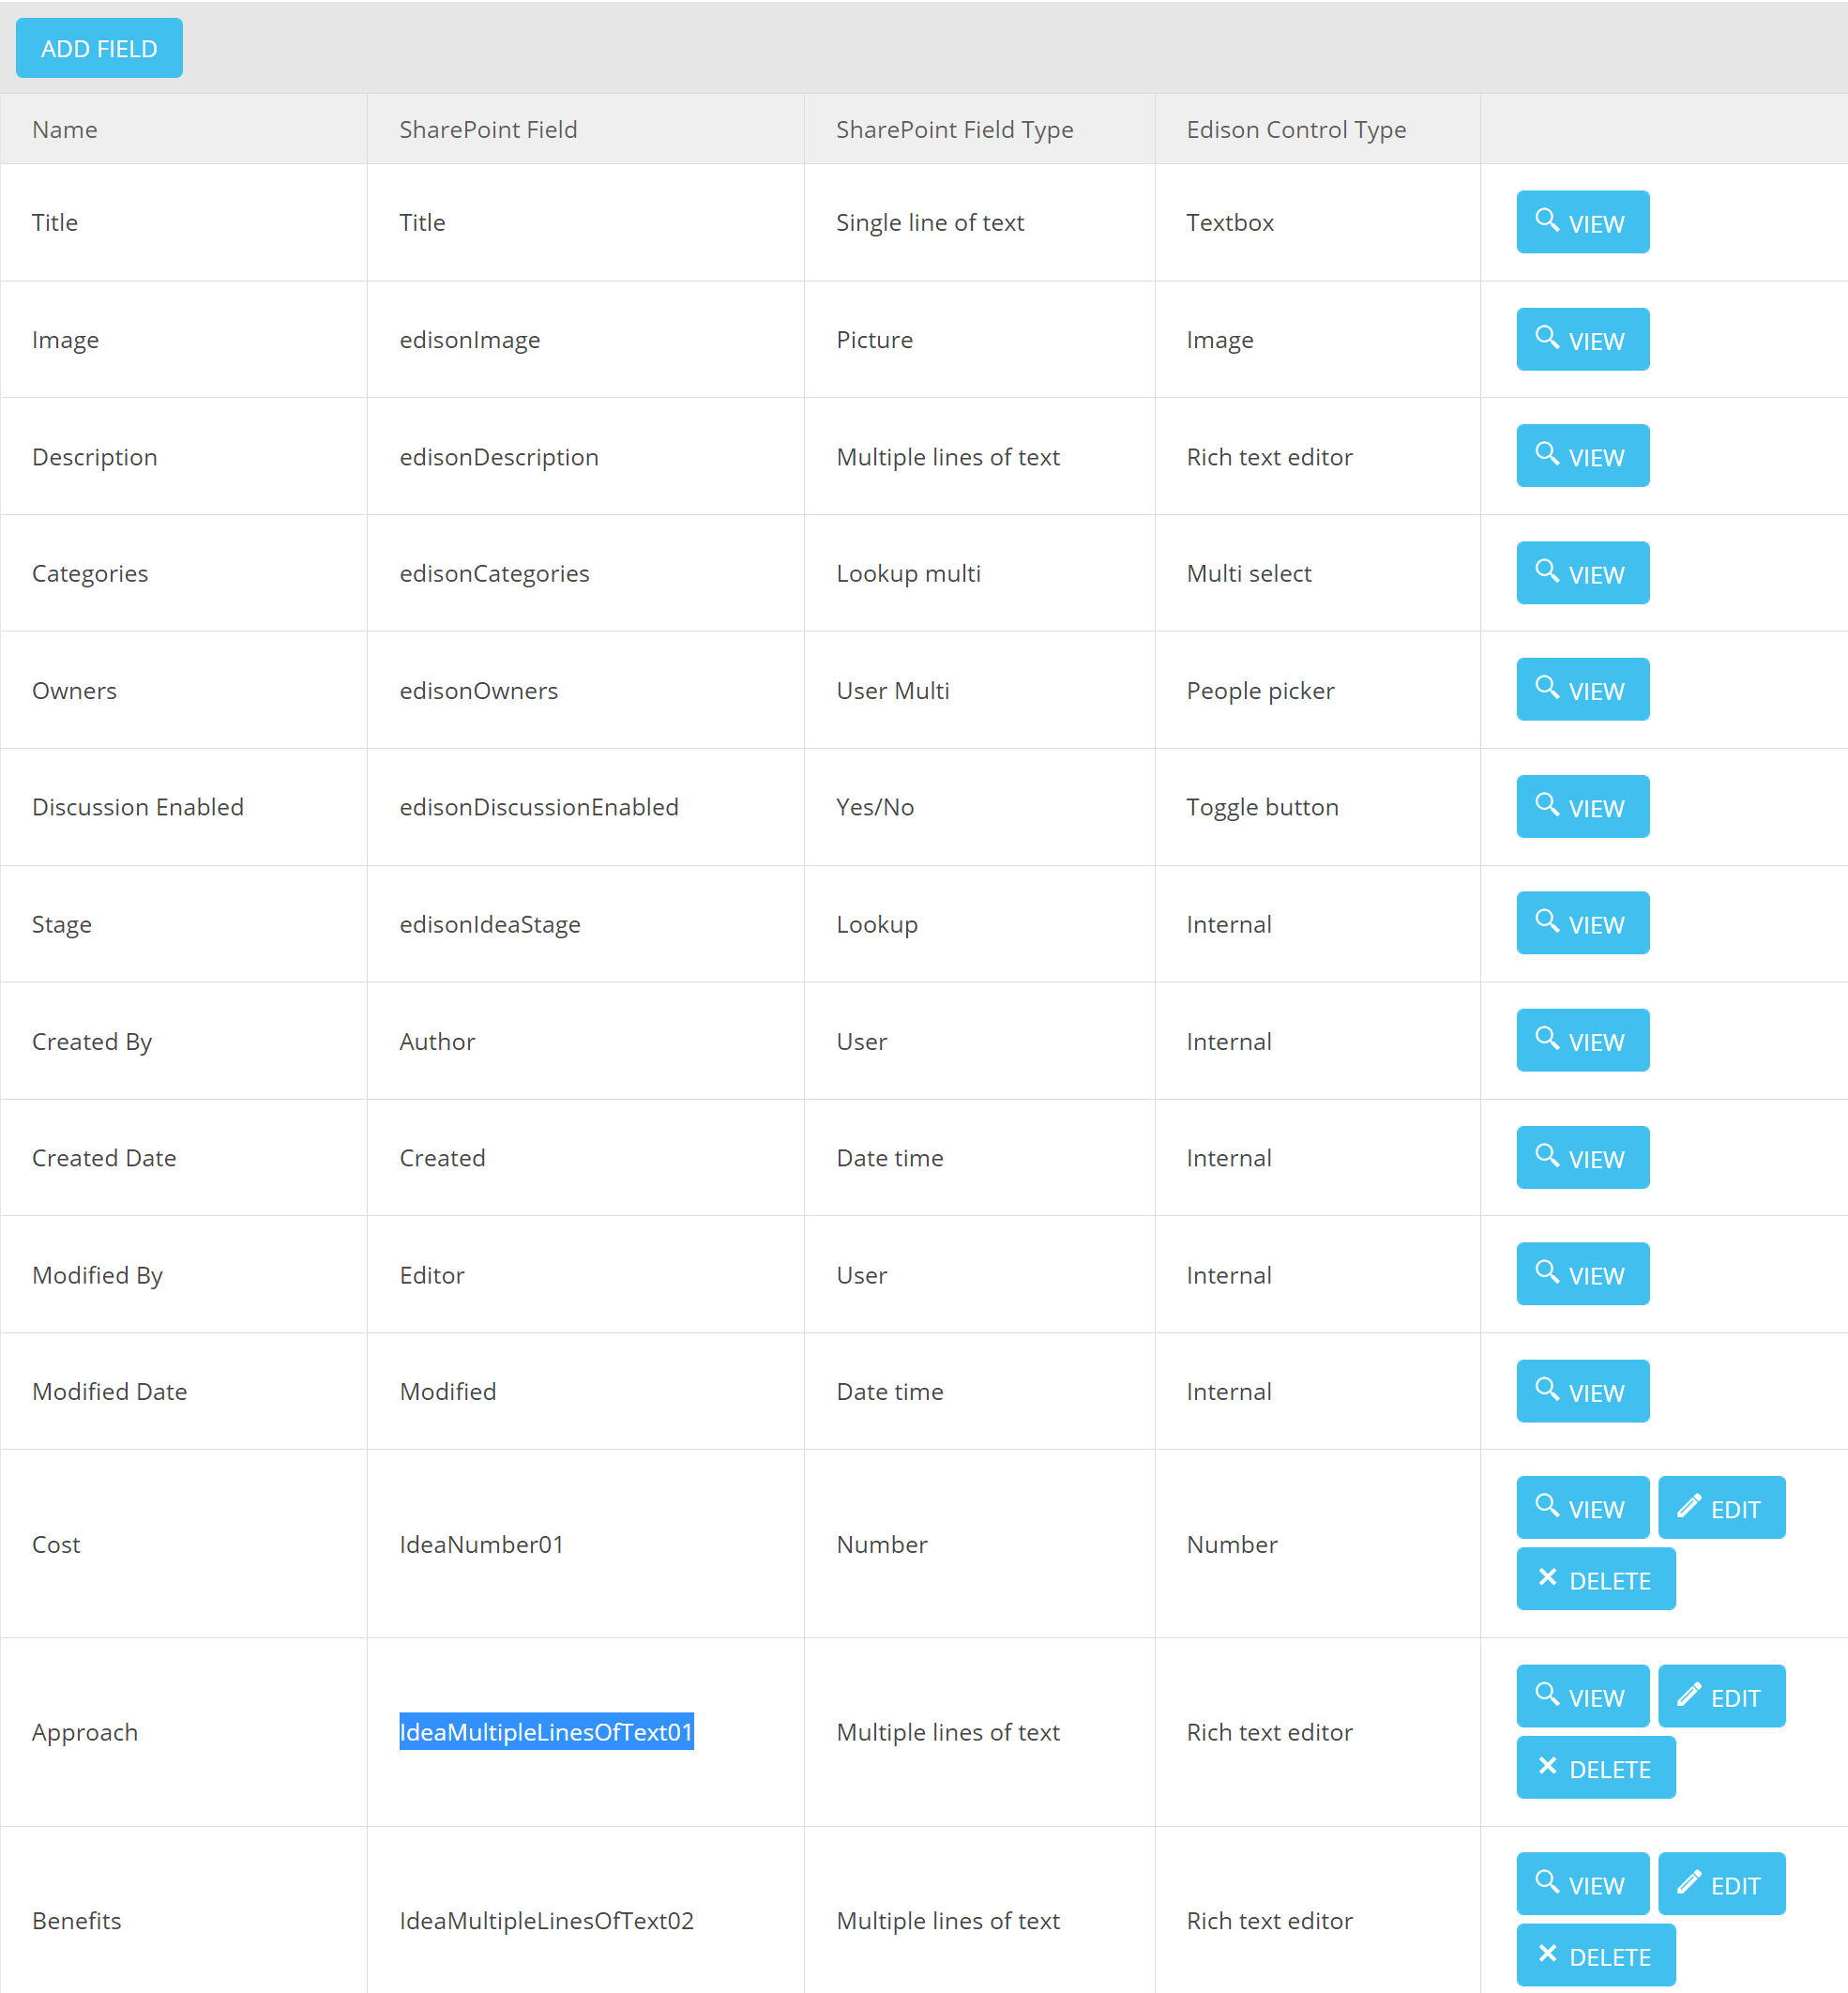
Knowing this, I'll select the IdeaMultipleLinesofText01 value in the Choose Columns dialog box.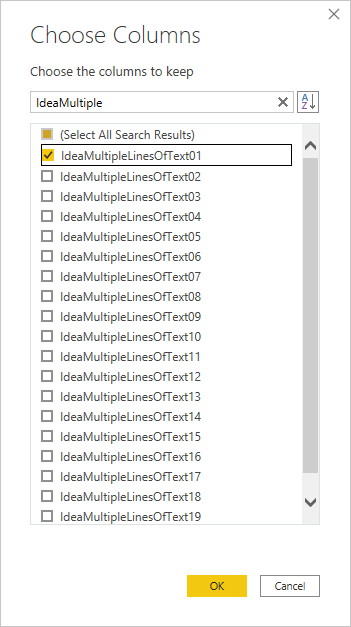
Continue this process with every field you wish to report on. Once you've selected all fields you want to report on, hit the OK button in the bottom right of the dialog box. - Once you have all the data fields you need, you'll need to rename them. First, select the last Applied Step in the query, Removed Columns.

Scroll across the middle panel and locate your custom fields. Rename them by right clicking on the column header, and select Rename.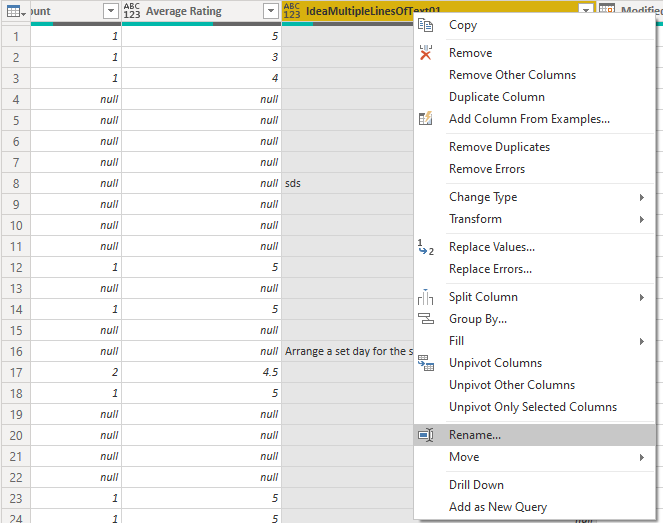
- The last step is to confirm your changes by selecting Close & Apply.
- Select Transform data
- Using your custom fields
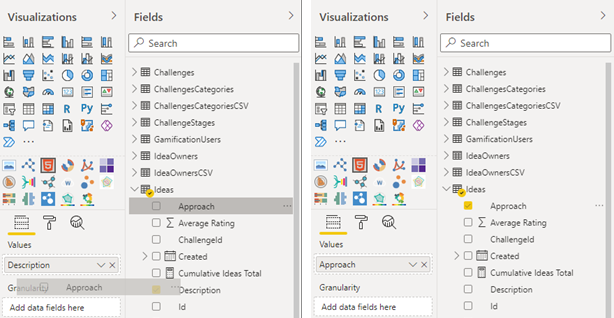
Once you've transformed your data, you'll be able to use these fields on your reports.- Begin by clicking on the visualization you wish to change.
- Navigate to the Fields panel on the right hand side, and expand the Ideas query. Here you'll see the new custom fields you have added.

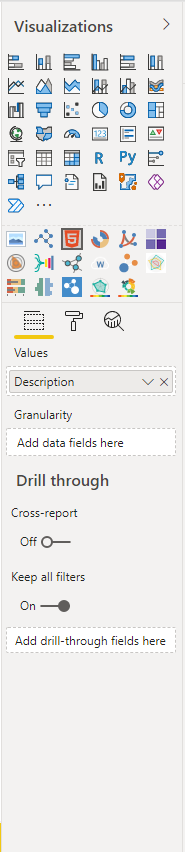
- Make sure the Visualizations panel is expanded out.
- To add your fields to a visualzation, drag and drop that field into the vizualisation data field placeholders in the Visualization panel. You can also add fields to visualizations by selecting the tick box next to the field in the Fields panel.
- Begin by clicking on the visualization you wish to change.
- Publishing your report
Now it's time to publish your report to the Power BI service.- Select Publish from the top toolbar, in the Home section
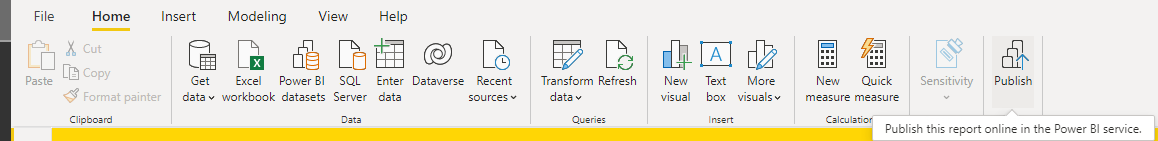
You may be prompted to sign in - use your organizational credentials, and complete and additional authentication steps as setup by the IT administrator.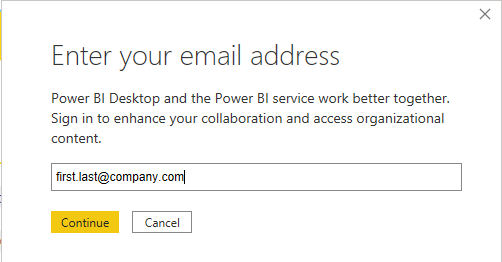
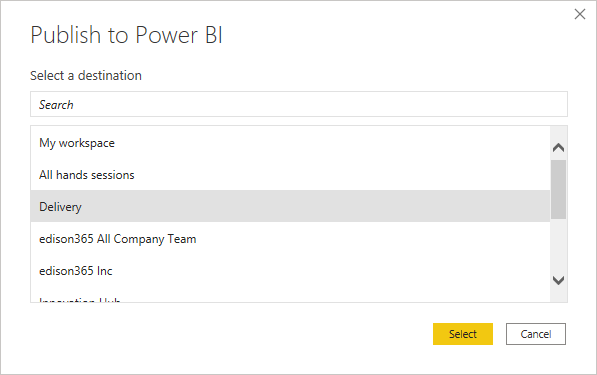
- Select workspace to publish to, the hit Select in the bottom right of the dialog box.
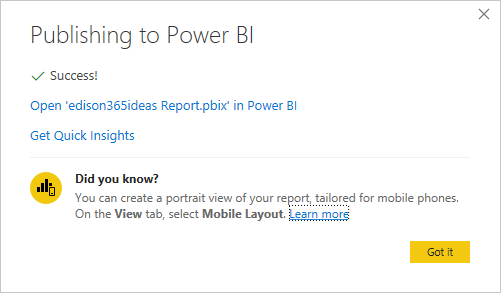
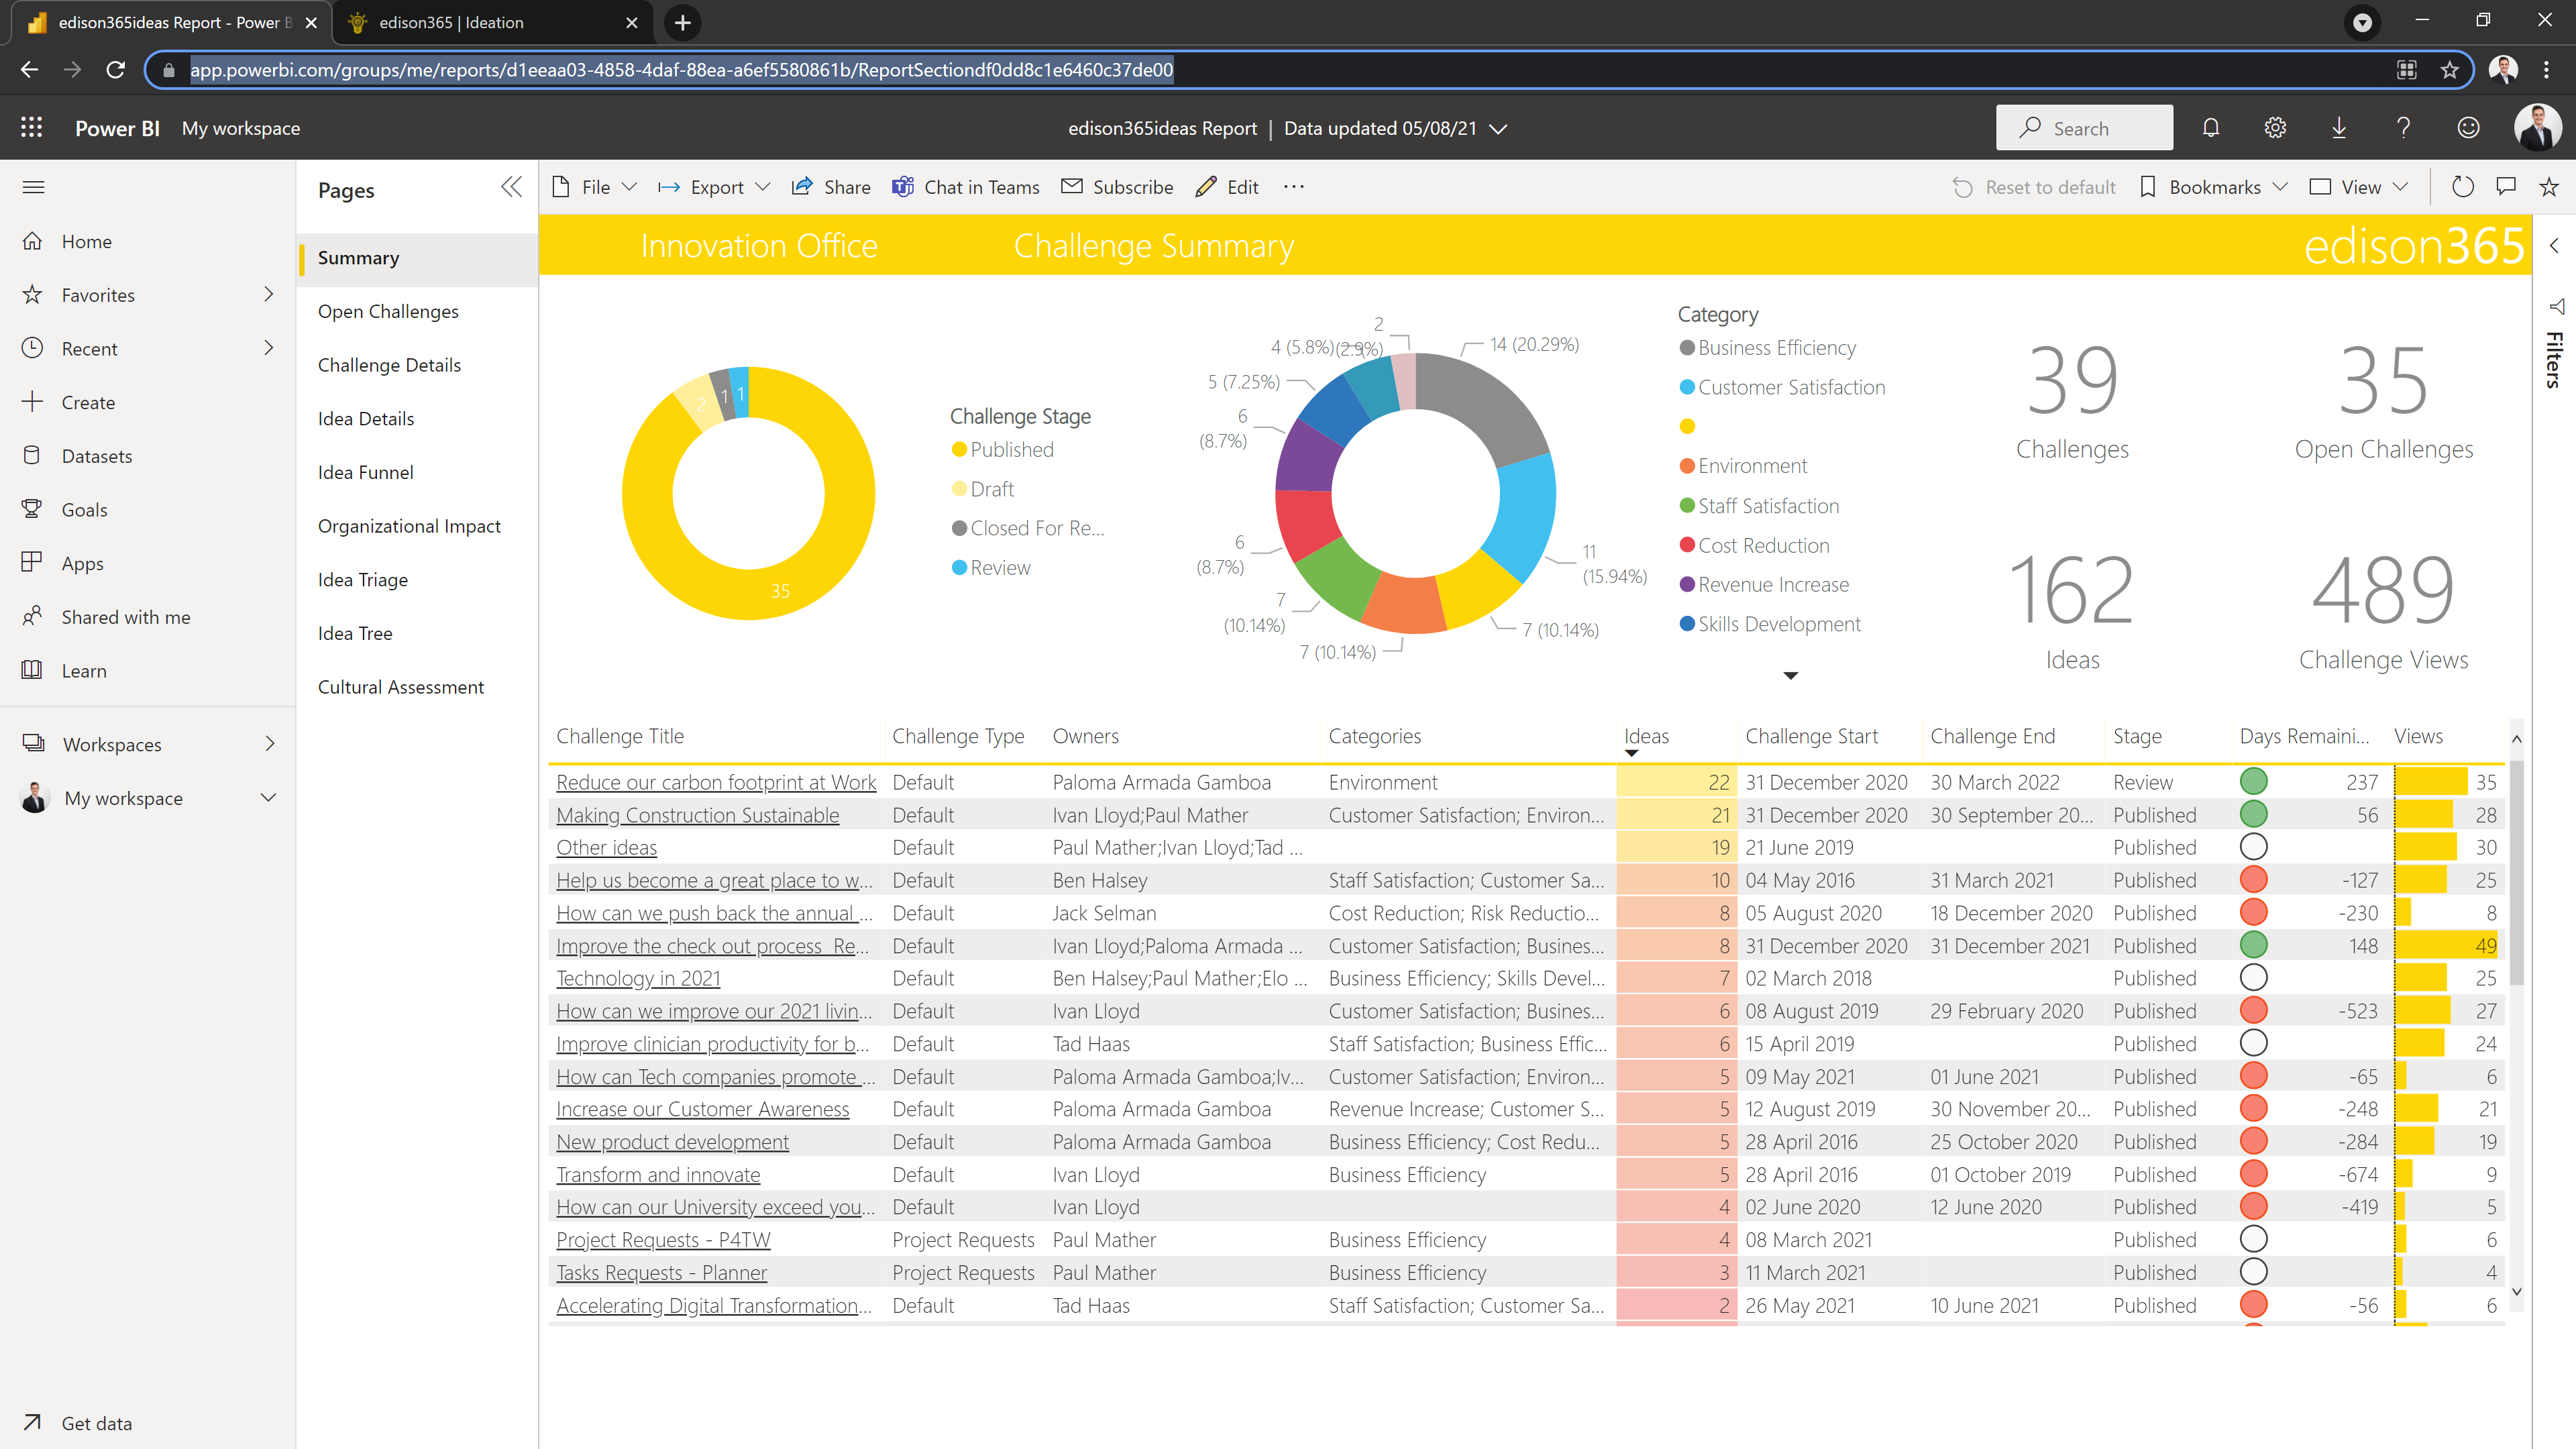
- Once published, click the Open link to navigate to the Power BI service and see your live report.
- Select Publish from the top toolbar, in the Home section
- Scheduled Refresh
To make sure the data in the report is keep up to date, you will need to schedule automatic refreshes of the data model.
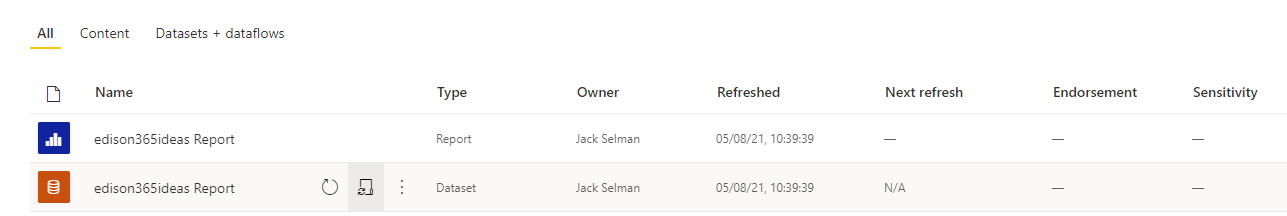
- Navigate to the workspace where you have published your report.
- Select the Scheduled Refresh button on the dataset row (shown here with a red icon)
Here, you may have to re-enter your credentials. This process, and the information required, is the same as the credentials step we went through earlier.
- The OData connections are the SharePoint connections. Select Edit Credentials.
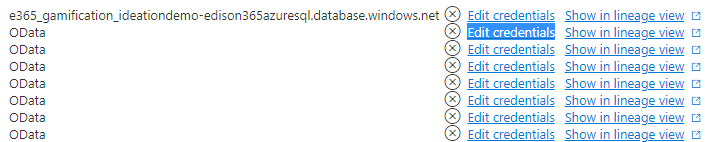
Next, set the Authentication method to OAuth2, and set the Privacy level setting for this data source to Organizational. Finally, select Sign in.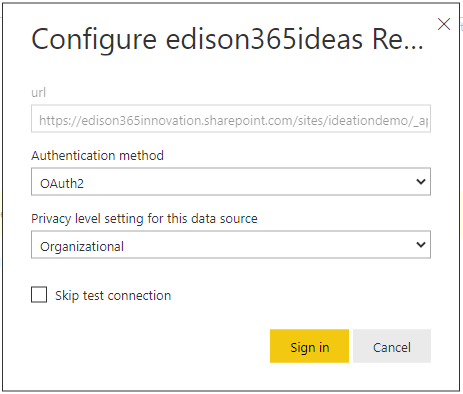
Complete this for each OData source - The Azure credentials are configured slightly differently. Again, select Edit credentials for the connection to your Azure SQL database.
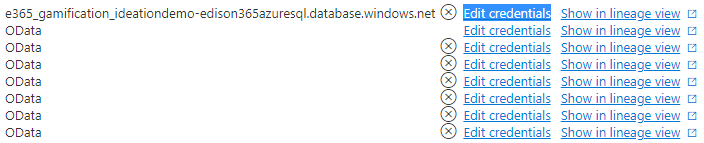
Set the Authentication method to Basic. Enter the User name and Password, and set the Privacy level setting for this data source to Organizational. Finally, select Sign in.
- The OData connections are the SharePoint connections. Select Edit Credentials.
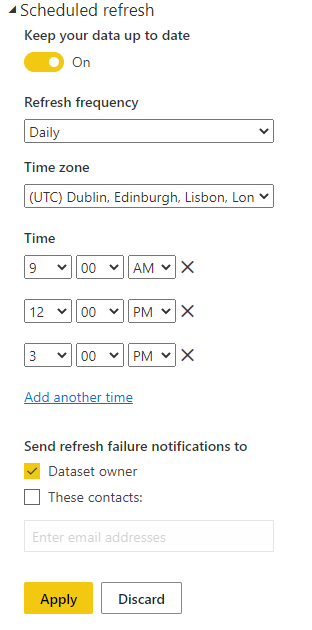
- Once you have confirmed all credentials, scroll down to the Scheduled refresh section. Switch the Keep your data up to date toggle on On. Here, set your desired refresh frequency, then select Apply
- Integrating your report in you edison365ideas app
The last step - and this is optional, but recommended, - is to surface this report within your edison365ideas app.
- Copy your report URL (from your browser)
- Navigate to your edison365ideas admin panel
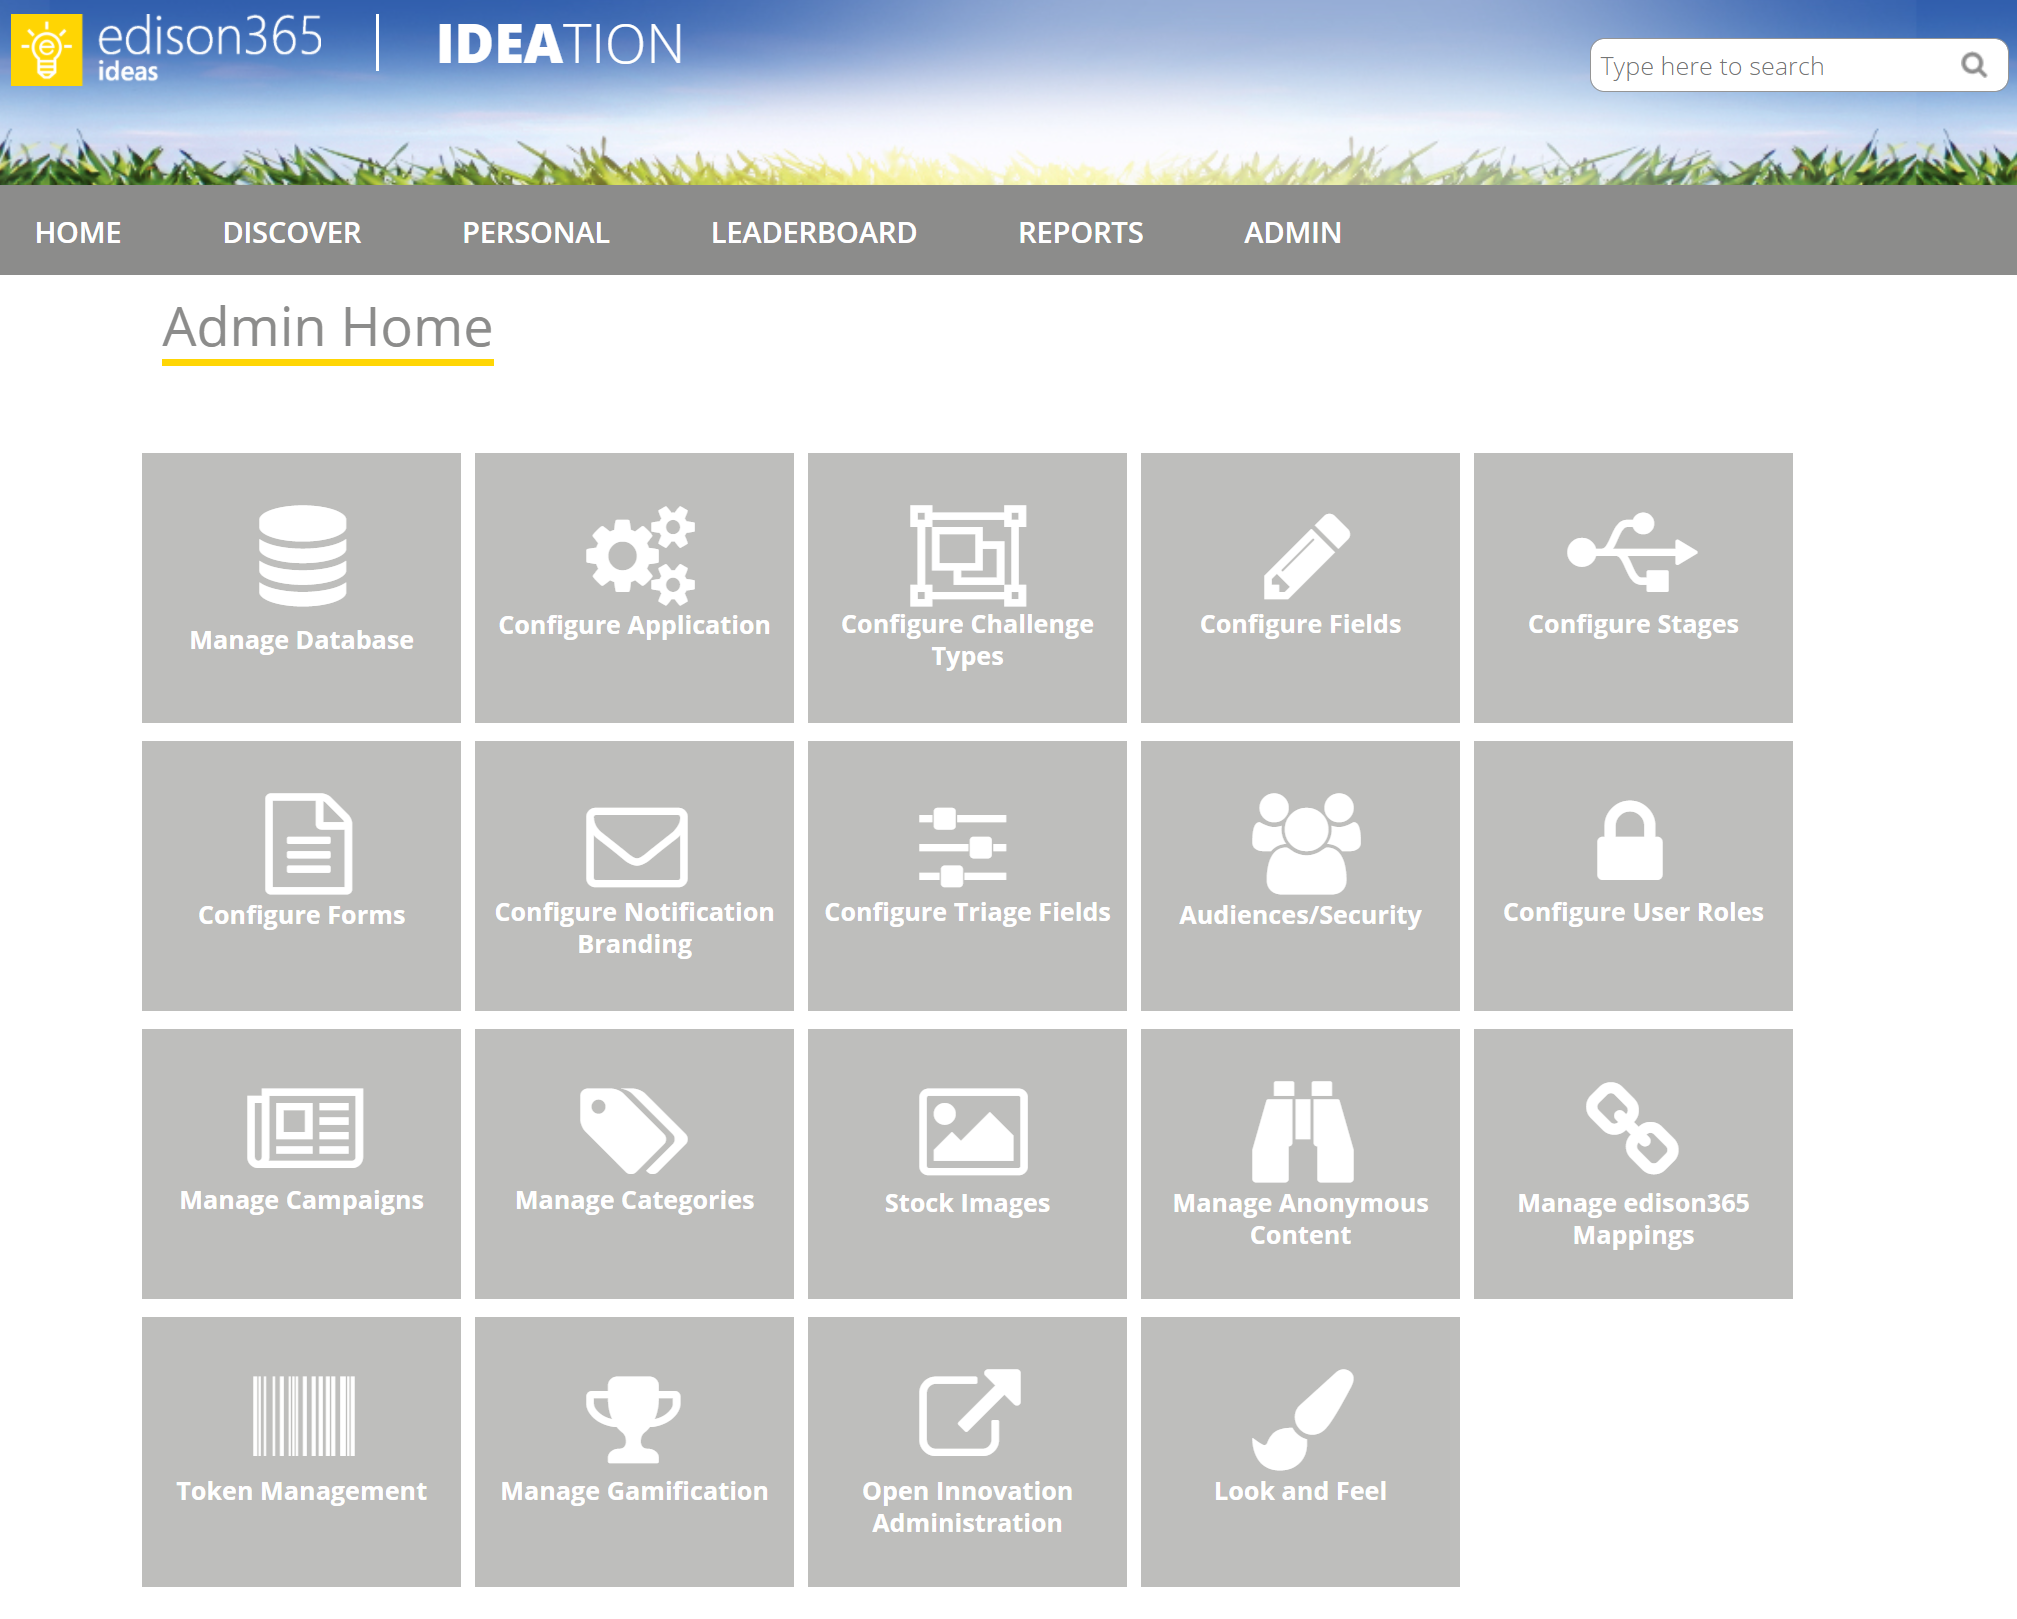
- Select the Configure application tile
- Paste your report URL into the Custom Report URL value
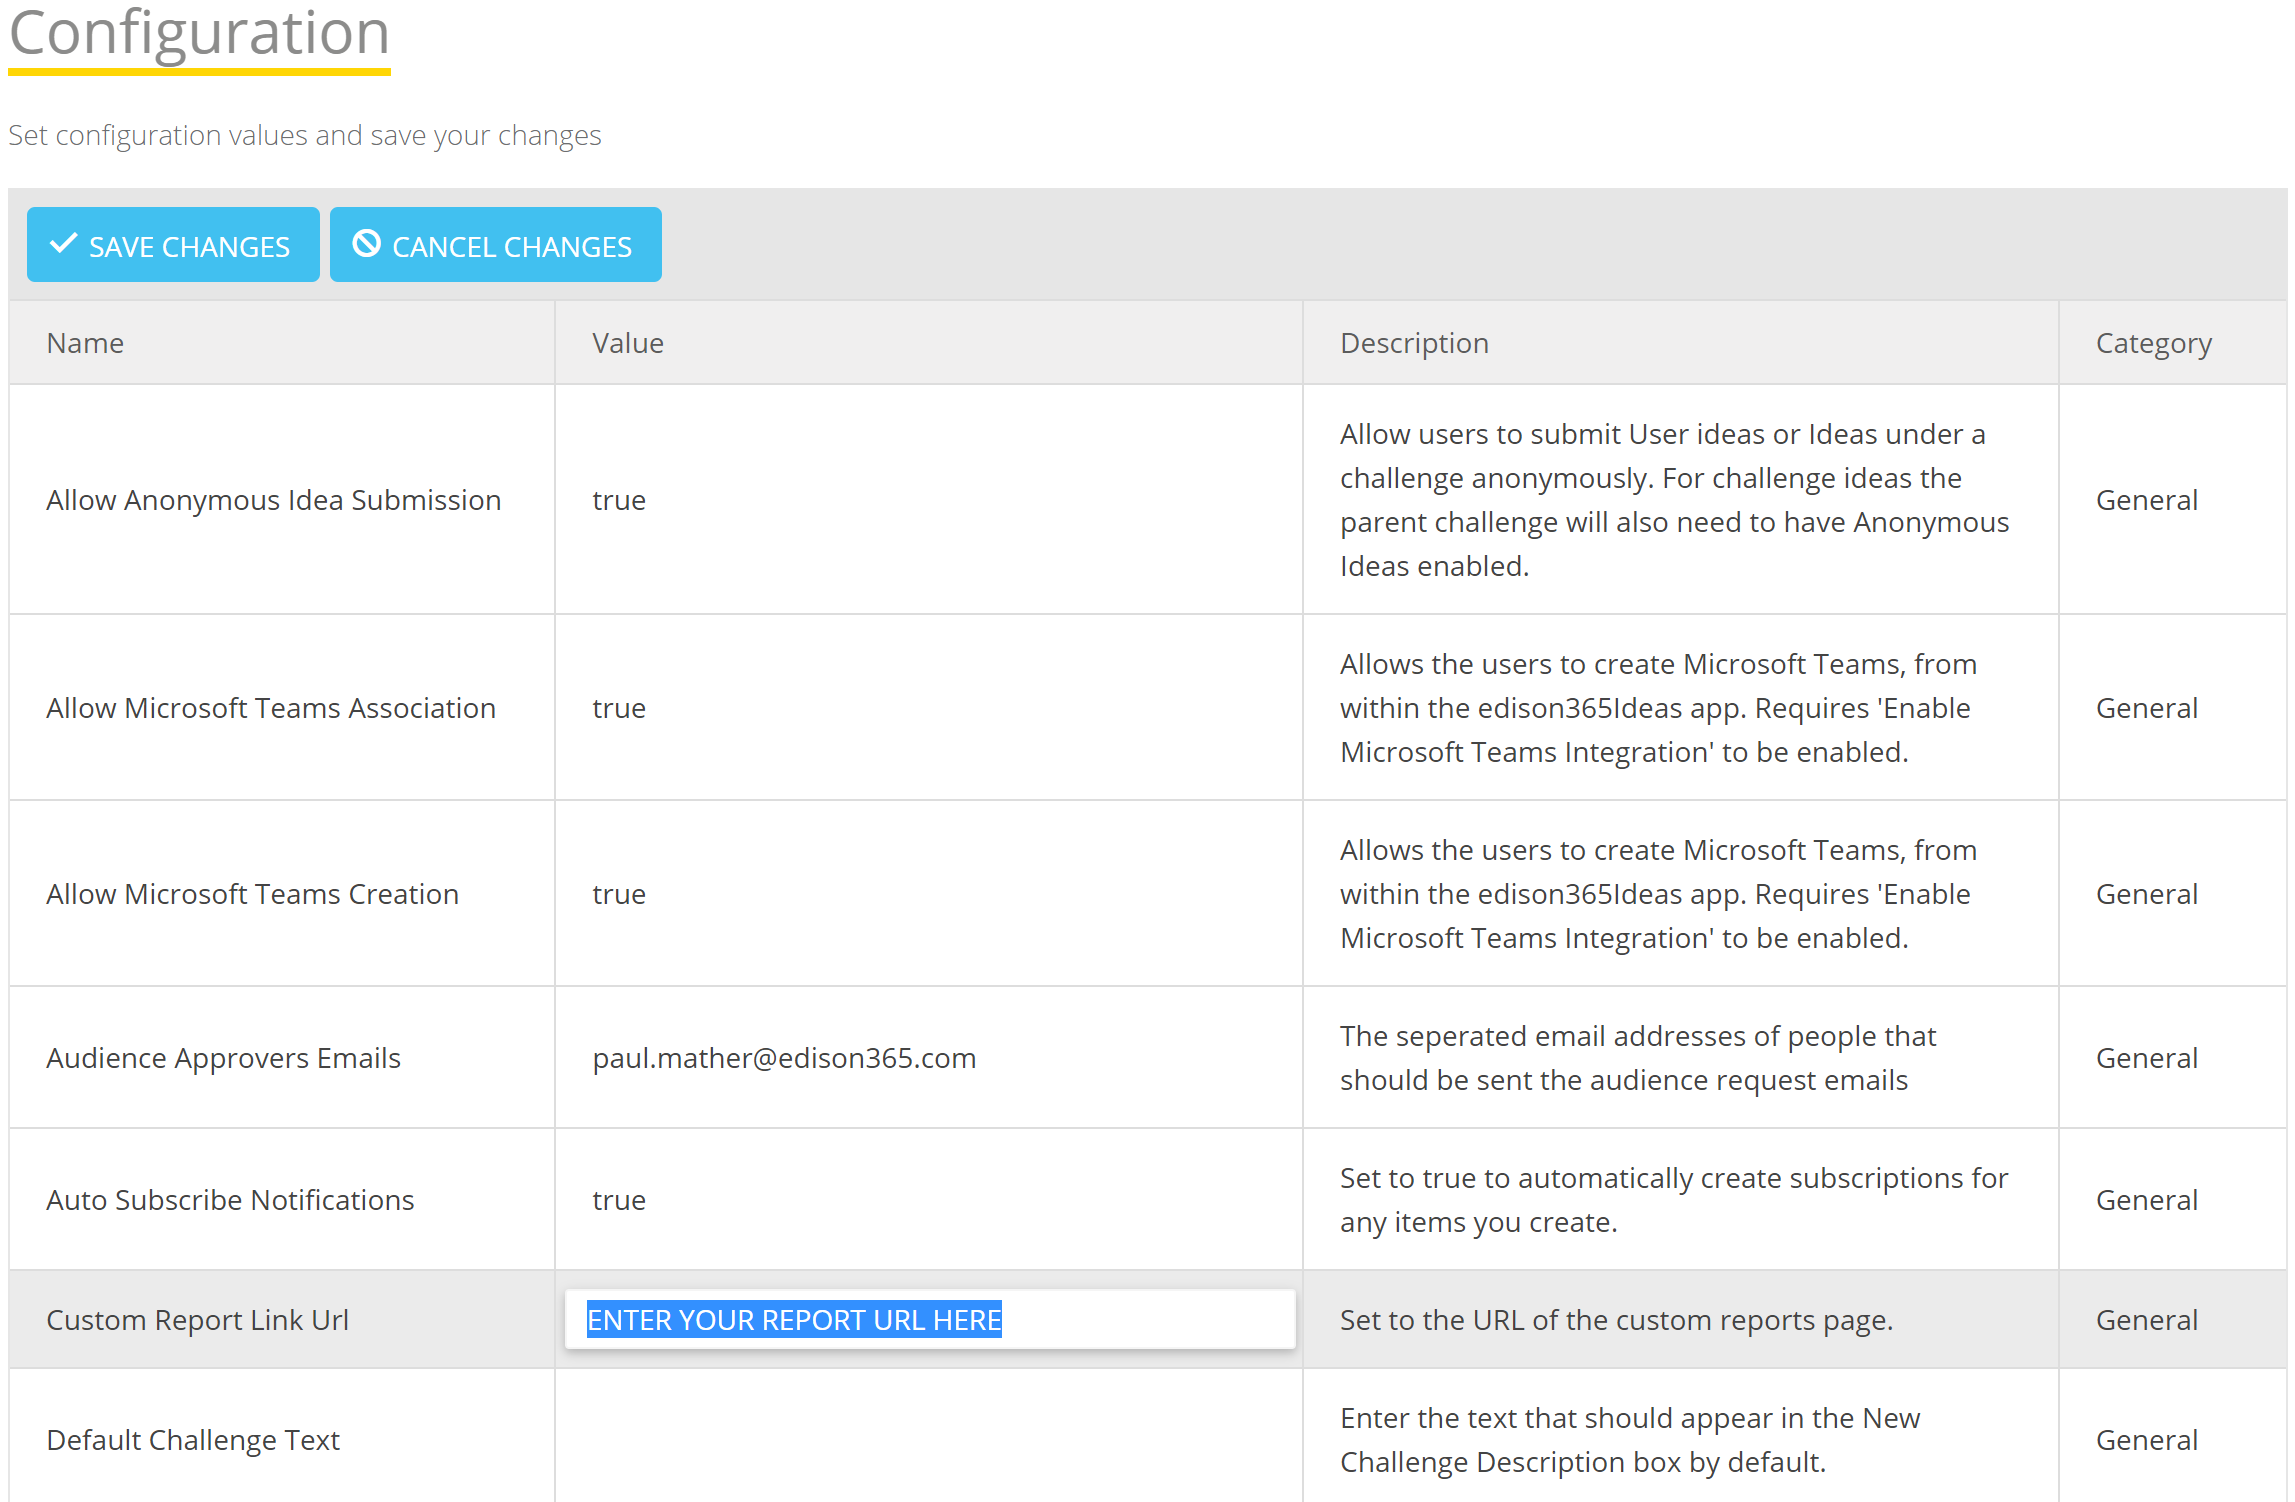
- Select Save Changes
- Copy your report URL (from your browser)
Once you've saved your changes in the admin panel, try refreshing the page. You will see a new button across the top of the navigation bar in your edison365ideas app called Reports - this link will take users to the Power BI report you have just created.
Adding this link into edison365ideas has no impact on the access and permissions for that report. This is set in the Power BI service. Adding the link into the app does not automatically grant users the permissions to access this resource.
Want dedicated, expert support with your reporting? Contact the team now to find out more, and let us take care of this for you.